
Page 82 - congress
P. 82
ORAL PRESENTATION / TAM METİN SÖZLÜ SUNUM
Table 1. Chemical compositions of BSO.
Fatty acid C-Chain Cas No Specifications (%)
Palmitic Acid C16:0 57-10-3 4-9
Stearic Acid C18:0 57-11-4 0.6-6
Oleic Acid C18:1 (n-9) 112-80-1 15-30
Linoleic Acid C18:2 (n-6) 60-33-3 40-57
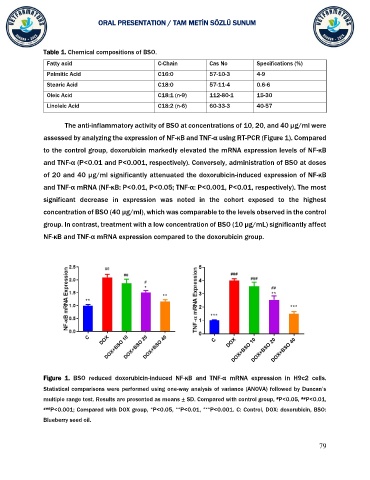
The anti-inflammatory activity of BSO at concentrations of 10, 20, and 40 µg/ml were
assessed by analyzing the expression of NF-κB and TNF-α using RT-PCR (Figure 1). Compared
to the control group, doxorubicin markedly elevated the mRNA expression levels of NF-κB
and TNF-α (P<0.01 and P<0.001, respectively). Conversely, administration of BSO at doses
of 20 and 40 µg/ml significantly attenuated the doxorubicin-induced expression of NF-κB
and TNF-α mRNA (NF-κB: P<0.01, P<0.05; TNF-α: P<0.001, P<0.01, respectively). The most
significant decrease in expression was noted in the cohort exposed to the highest
concentration of BSO (40 µg/ml), which was comparable to the levels observed in the control
group. In contrast, treatment with a low concentration of BSO (10 µg/mL) significantly affect
NF-κB and TNF-α mRNA expression compared to the doxorubicin group.
Figure 1. BSO reduced doxorubicin-induced NF-κB and TNF-α mRNA expression in H9c2 cells.
Statistical comparisons were performed using one-way analysis of variance (ANOVA) followed by Duncan’s
multiple range test. Results are presented as means ± SD. Compared with control group, P<0.05, P<0.01,
#
##
**
*
### P<0.001; Compared with DOX group, P<0.05, P<0.01, *** P<0.001. C: Control, DOX: doxorubicin, BSO:
Blueberry seed oil.
79