
Page 43 - congress
P. 43
ORAL PRESENTATION / TAM METİN SÖZLÜ SUNUM
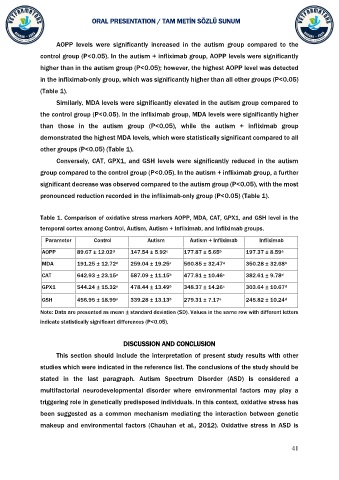
AOPP levels were significantly increased in the autism group compared to the
control group (P<0.05). In the autism + infliximab group, AOPP levels were significantly
higher than in the autism group (P<0.05); however, the highest AOPP level was detected
in the infliximab-only group, which was significantly higher than all other groups (P<0.05)
(Table 1).
Similarly, MDA levels were significantly elevated in the autism group compared to
the control group (P<0.05). In the infliximab group, MDA levels were significantly higher
than those in the autism group (P<0.05), while the autism + infliximab group
demonstrated the highest MDA levels, which were statistically significant compared to all
other groups (P<0.05) (Table 1).
Conversely, CAT, GPX1, and GSH levels were significantly reduced in the autism
group compared to the control group (P<0.05). In the autism + infliximab group, a further
significant decrease was observed compared to the autism group (P<0.05), with the most
pronounced reduction recorded in the infliximab-only group (P<0.05) (Table 1).
Table 1. Comparison of oxidative stress markers AOPP, MDA, CAT, GPX1, and GSH level in the
temporal cortex among Control, Autism, Autism + Infliximab, and Infliximab groups.
Parameter Control Autism Autism + Infliximab Infliximab
AOPP 89.67 ± 12.02 147.54 ± 5.92 177.87 ± 5.65 197.37 ± 8.59
c
d
b
a
c
d
b
a
MDA 191.25 ± 12.72 259.04 ± 19.25 560.85 ± 32.47 350.28 ± 32.68
CAT 642.93 ± 23.15 587.09 ± 11.15 477.81 ± 10.46 382.61 ± 9.78
d
a
c
b
d
b
c
a
GPX1 544.24 ± 15.32 478.44 ± 13.49 348.37 ± 14.26 303.64 ± 10.67
GSH 456.95 ± 18.99 339.28 ± 13.13 279.31 ± 7.17 245.82 ± 10.24
b
d
c
a
Note: Data are presented as mean ± standard deviation (SD). Values in the same row with different letters
indicate statistically significant differences (P<0.05).
DISCUSSION AND CONCLUSION
This section should include the interpretation of present study results with other
studies which were indicated in the reference list. The conclusions of the study should be
stated in the last paragraph. Autism Spectrum Disorder (ASD) is considered a
multifactorial neurodevelopmental disorder where environmental factors may play a
triggering role in genetically predisposed individuals. In this context, oxidative stress has
been suggested as a common mechanism mediating the interaction between genetic
makeup and environmental factors (Chauhan et al., 2012). Oxidative stress in ASD is
41